Technical Analysis (Free TradingView Indicator)
A free TradingView indicator that automatically identifies support/resistance levels and key intraday zones so you can see essential market structure without manual drawing or subjective interpretation.
- •Shows CDH/CDL (Current Day High/Low), PDH/PDL (Previous Day High/Low), weekly highs/lows
- •Displays Fair Value Gaps (FVGs) and identifies swing highs/lows automatically
- •Validates breakouts vs liquidity sweeps with dynamic volatility measurements
Who it's for:
- ✓Traders who want essential intraday levels without manual drawing
- ✓Price action traders who need objective support/resistance reference points
Not ideal for:
- ✗Traders who want entry/exit signals (this shows levels, not signals)
- ✗Those who prefer lagging indicators (this is pure price action, no moving averages)

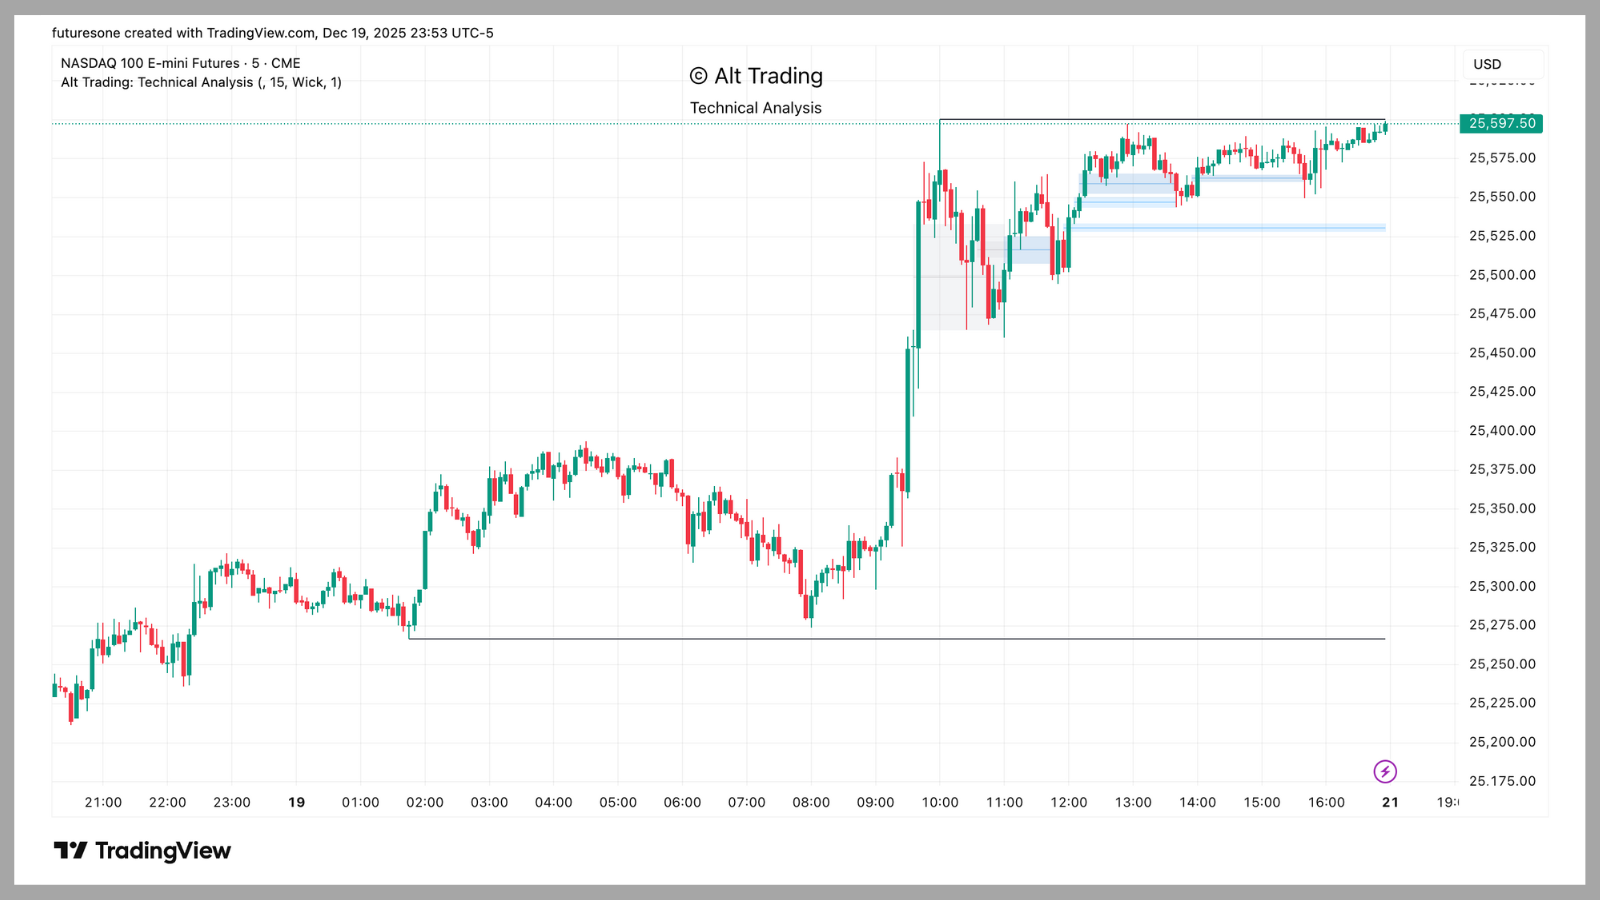
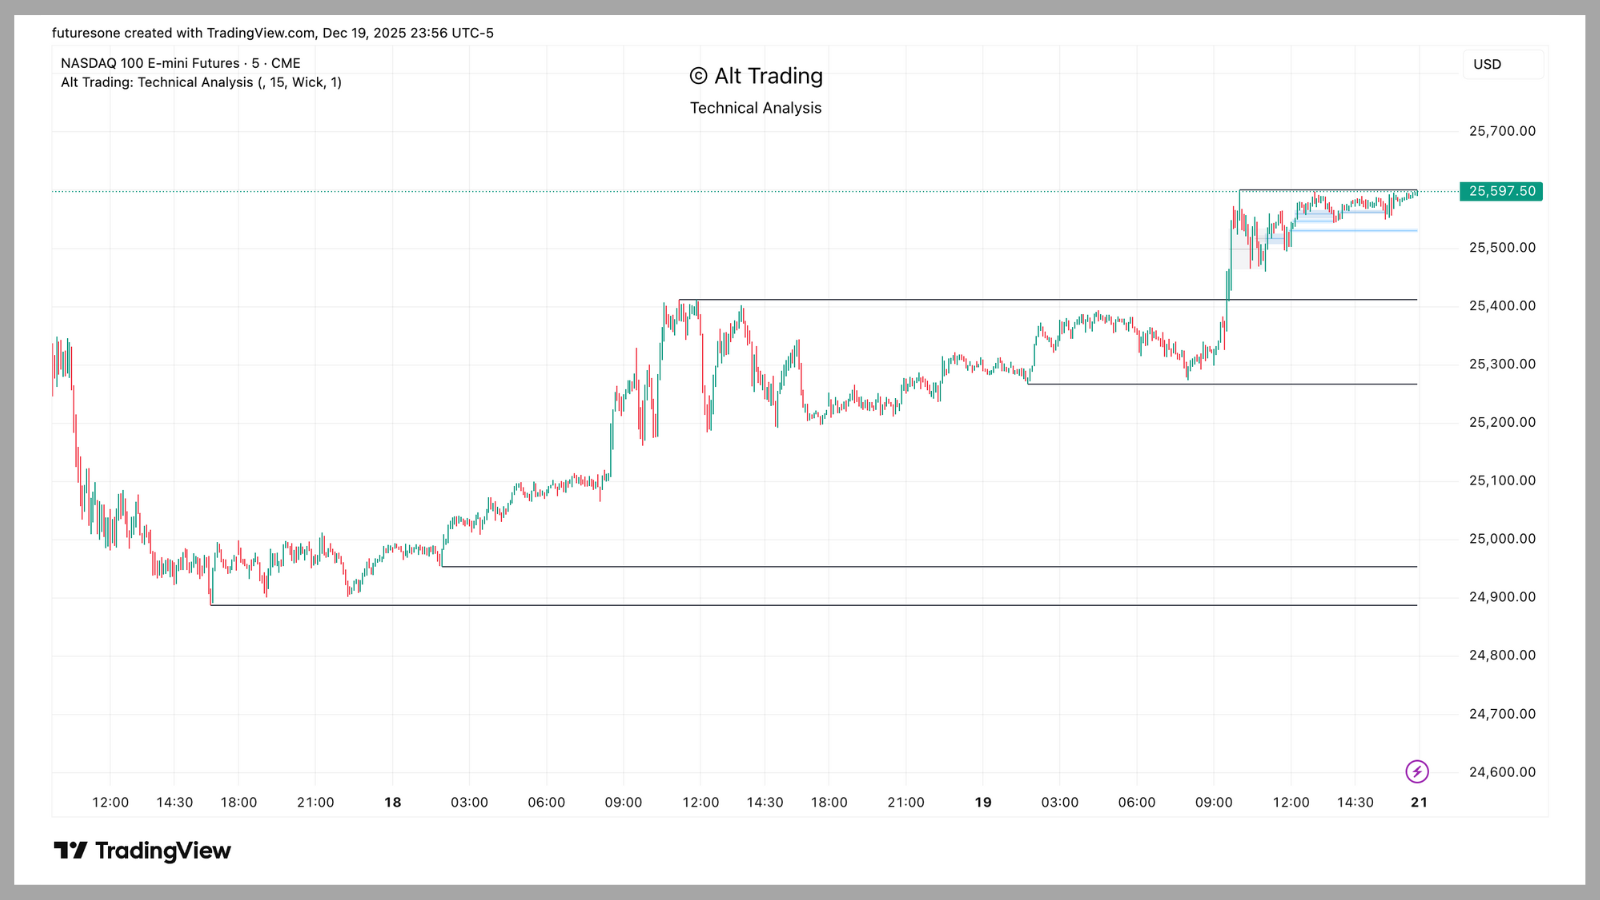
What you get on the chart
- •CDH/CDL lines: Current Day High and Low (updated throughout the session)
- •PDH/PDL lines: Previous Day High and Low (reference from prior session)
- •Weekly highs/lows: Current Week High and Low (CWH/CWL)
- •Fair Value Gaps (FVGs): Most recent bullish/bearish imbalances with invalidation zones
- •Swing points: Automatically detected swing highs and lows (short, intermediate, long-term)
- •Breakout validation: Visual distinction between confirmed breakouts and liquidity sweeps
How to use it
Best timeframes
Works on any timeframe. Most useful on 5m, 15m, 1h, and 4h charts where intraday levels are meaningful. Lower timeframes (1m/2m) may show too many levels.
Best markets
Optimized for NQ, ES, CL, GC, and YM futures. Works on any liquid futures contract with clear session structure.
Default workflow
- Add indicator to chart - levels appear automatically (no configuration needed)
- Use PDH/PDL as reference zones for today's session (price often reacts at these levels)
- Watch CDH/CDL for intraday extremes (breakouts above/below signal continuation)
- Use FVGs for entry zones (price often retraces to fill gaps before continuing)
- Check breakout validation to distinguish real moves from liquidity sweeps
Common mistakes
- Trading every level touch (not all levels are equal—use confluence with other tools)
- Ignoring breakout validation (false breakouts vs confirmed moves)
- Using on very low timeframes where levels change too frequently
- Expecting entry/exit signals (this shows levels, pair it with other indicators for signals)
Settings guide
Show swing points
Toggle swing high/low markers. Short-term = minimal delay, intermediate/long-term = more reliable but depend on later price action. Default: All enabled.
Support/resistance lines
Show/hide structure lines connecting swing points. Useful for trend visualization. Default: Enabled.
Breakout validation
Enable/disable logic that distinguishes confirmed breakouts from liquidity sweeps. Uses dynamic volatility measurements. Default: Enabled.
Level labels
Show text labels on support/resistance lines (CDH, CDL, PDH, PDL, etc.). Default: Enabled.
FVG display
Show/hide Fair Value Gaps and their invalidation zones. Default: Enabled.
Examples
Example: PDH resistance holds
Price approaches PDH (Previous Day High) from below. Level holds as resistance—price bounces and continues lower. This is a classic support/resistance reaction. Indicator correctly identifies the level without manual drawing.
Example: Confirmed breakout vs liquidity sweep
Price breaks above PDH. Validation logic checks if close is beyond volatility deviation zone. Confirmed breakout = genuine move (green highlight). False breakout = liquidity sweep (red highlight). Indicator correctly distinguishes between the two.
Example: FVG retracement entry
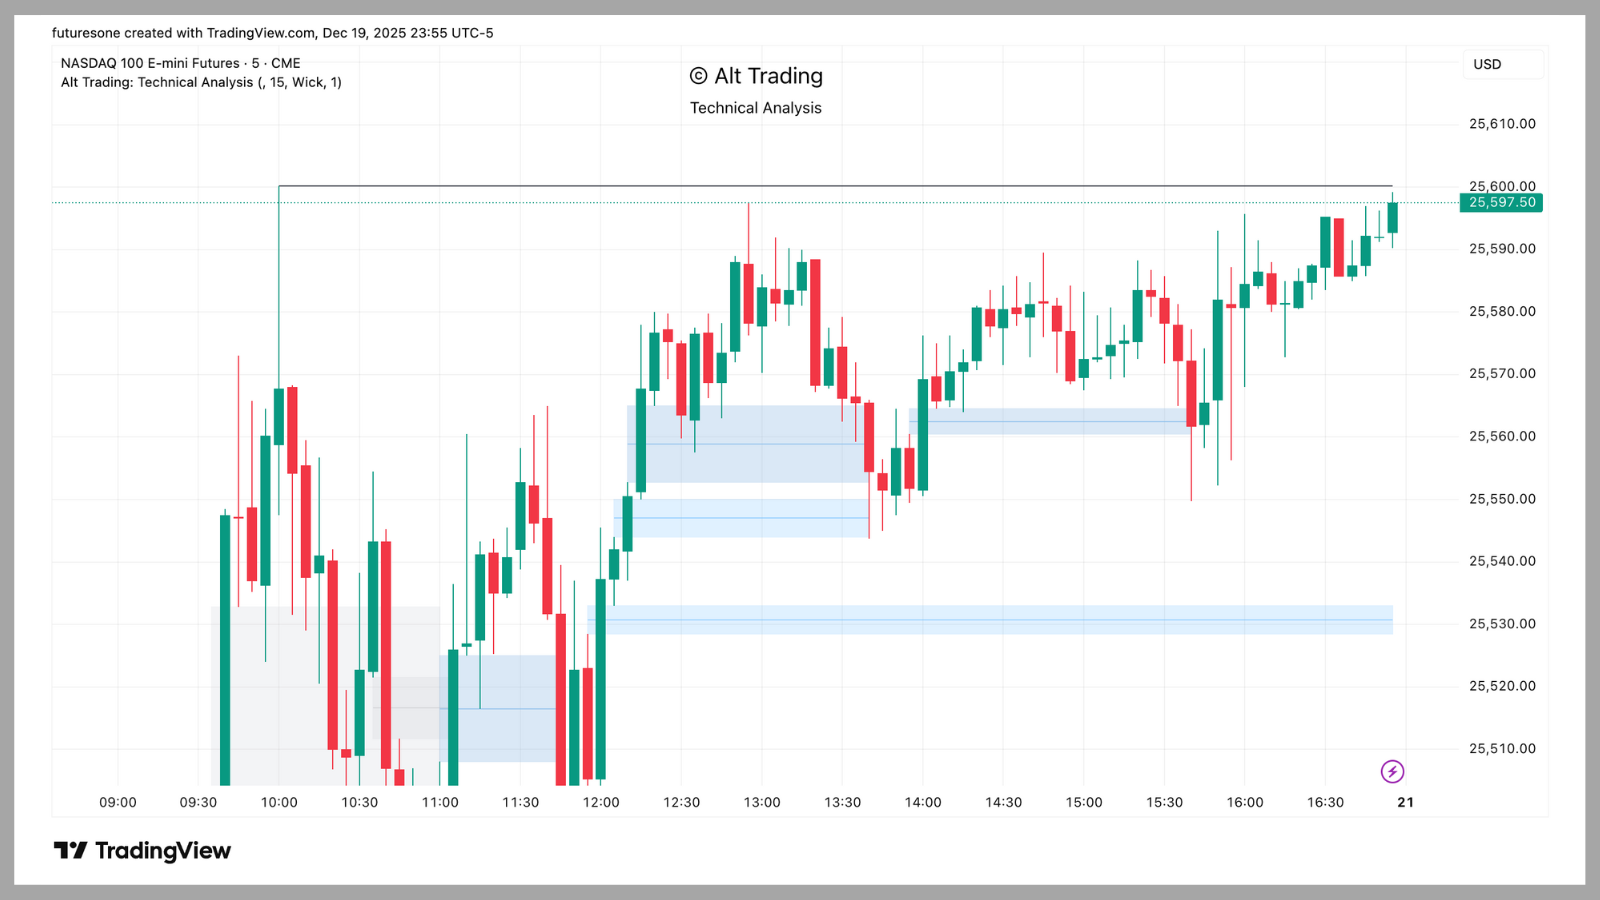
Bullish FVG forms (price gaps up). Price retraces to fill the gap (invalidation zone). This becomes an entry zone—price often bounces from FVG fills before continuing. Indicator highlights the gap and invalidation zone automatically.
Limitations / what it's NOT
When it works: Clear market structure, during normal volatility conditions, when levels align with other confluence factors, when breakout validation confirms genuine moves.
When it fails: During extreme volatility spikes (news events), in very choppy markets without clear structure, when levels conflict (multiple timeframes showing different structure).
What it doesn't claim: This shows levels, not entry/exit signals. It doesn't predict price direction—it identifies where price has reacted historically. You still need other tools for actual trade execution.
Repainting: Short-term swing points may adjust slightly as new candles form, but validated structures and daily/weekly levels remain fixed once confirmed. CDH/CDL update throughout the session (this is intentional).
Why we built this
Most traders manually draw support/resistance levels, which introduces bias and inconsistency. Technical Analysis solves this by automatically detecting swing points and key intraday levels—ensuring objective, repeatable structure identification.
The breakout validation logic is crucial—it distinguishes between genuine moves and liquidity sweeps using dynamic volatility measurements. This prevents false signals and helps you trade with more confidence.
Best paired with: Regime Detection (for trend context) or Mike's ORB Signal Pro (for session-level context).
Version History
v1.2 (Dec 5, 2025)
Added breakout validation logic, improved FVG detection, enhanced swing point accuracy.
v1.1 (Nov 23, 2025)
Initial release with CDH/CDL, PDH/PDL, weekly highs/lows, and swing point detection.
FAQ
What makes Technical Analysis different from other support/resistance indicators?
It's entirely based on pure price action—no user inputs or lagging filters—ensuring objective and repeatable structure detection. The indicator is specifically optimized for high-liquidity futures markets and provides breakout validation to distinguish genuine moves from liquidity sweeps.
How can I use this indicator with my trading strategy?
Use it as a reference for key intraday levels. Combine support/resistance levels with other Alt Trading indicators, FVGs, or liquidity concepts to build a comprehensive technical analysis-based trading approach. The indicator works well for both trend-following and counter-trend strategies.
Does the indicator repaint?
Short-term swing points may adjust slightly as new candles form, but validated structures and daily/weekly levels remain fixed once confirmed. CDH/CDL update throughout the session (this is intentional for intraday reference).
How can I access Technical Analysis?
You can get access to the Technical Analysis indicator directly from the Alt Trading Library, available for TradingView, completely free. Claim free access here.
What markets and timeframes work best?
Optimized for NQ, ES, CL, GC, and YM futures. Works on any timeframe, but most useful on 5m, 15m, 1h, and 4h charts where intraday levels are meaningful. Avoid very low timeframes (1m/2m) where levels change too frequently.
Related Alt Trading Indicators
- Regime Detection - Trend filter and status table for long/short/flat signals
- Mike's ORB Signal Pro - 15-minute ORB + integrated money management
- Tom's Reversal Strategy - Hourly bias + BOS confirmation with blue window timing
Want signals + execution rules?
FuturesOne includes B1 (breakout), P1 (pivots), and S1 (swing) systems with regime filters and risk management. $49/mo per system.
View FuturesOne PlansWant evolving research + weekly updates?
Alt Trading Lab includes all 3 FuturesOne systems (B1 + P1 + S1) plus ongoing research updates. $99/mo.
Join Alt Trading Lab